If you’ve been in the workforce for any length of time, you’ve undoubtedly encountered a Venn diagram. A Venn diagram is an illustration that uses circles to show the relationships among things or finite groups of things. Circles that overlap have a commonality while circles that do not overlap do not share those traits.
As it turns out, a Venn diagram is really useful at depicting what is probably the most extreme vulnerability in cybersecurity today.
Vulnerability #1: Healthcare
If you haven’t heard, healthcare is one of the top targets for bad actors today. Some of the statistics are staggering.
- Hospitals account for 30% of all data breaches.
- There is a 75.6% chance of a breach of at least 5 million records in the next year.
- 95% of identity theft comes from stolen healthcare records.
- 89% of healthcare providers have suffered data breaches in the past two years.
And healthcare breaches are the most expensive too. According to IBM’s Cost of a Data Breach Report 2023, “The highly regulated healthcare industry has seen a considerable rise in data breach costs since 2020. For the 13th year in a row, the healthcare industry reported the most expensive data breaches, at an average cost of USD 10.93 million.”
This is one of the two vulnerabilities that make up our Venn diagram: healthcare.
Vulnerability #2: IoT
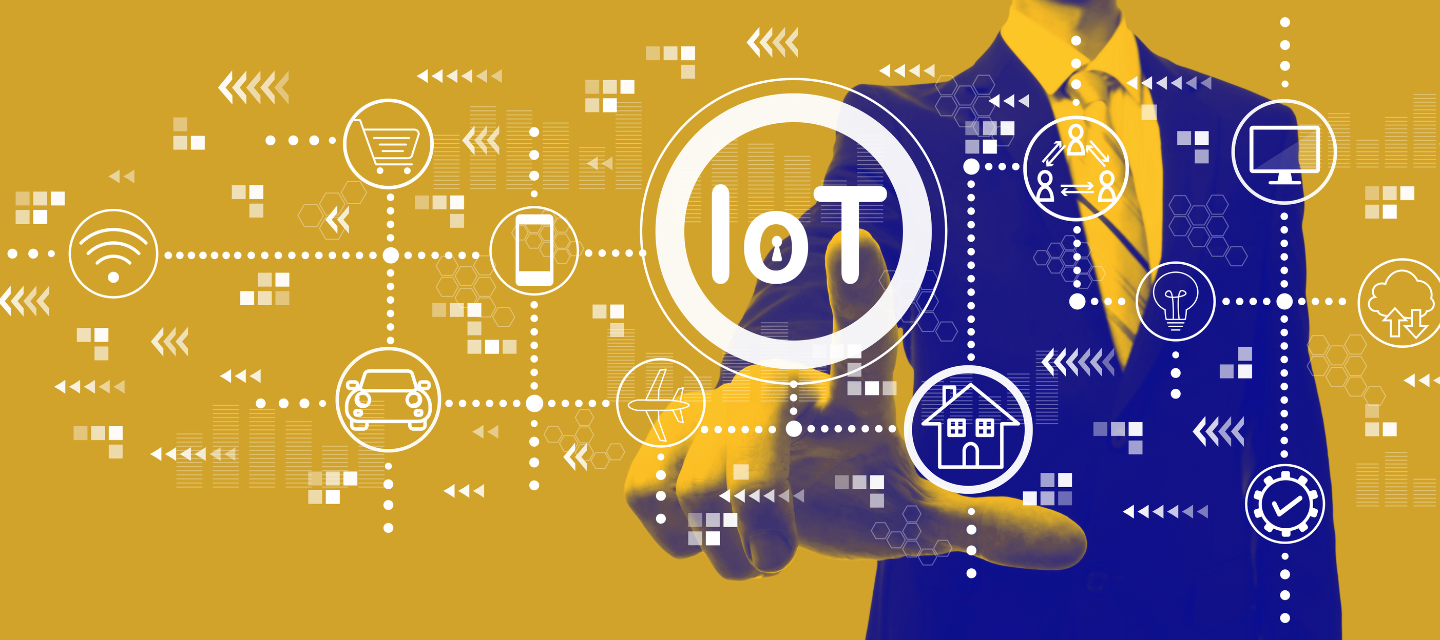
Right behind healthcare, in terms of targets for bad actors, are IoT (internet-of-things) devices.
A study published by Ponemon shows that the number of breaches due to unsecured connected devices now accounts for 26% of security incidents, up from the previous figure of 15%. However, actual numbers of breaches may be far greater as organizations are often not fully aware of how many web-connected devices their employees and teams are using.
To make matters worse, the study also discovered that budgets aren’t up to managing third-party risks coming through IoT gadgets. So, both companies with IoT devices and companies in their supply chain are at risk.
This is the other of the two vulnerabilities that make up our Venn diagram: IoT devices.
So, what happens at the intersection of healthcare and IoT devices? What is the vulnerability of the Venn diagram of these two targets?
Overlapping Circles
The intersection of healthcare and IoT is referred to as IoMT. From Ordr.net, “The Internet of Medical Things (IoMT) is the network of Internet-connected medical devices, hardware infrastructure, and software applications used to connect healthcare information technology. Sometimes referred to as IoT in healthcare, IoMT allows wireless and remote devices to securely communicate over the Internet to allow rapid and flexible analysis of medical data.”
As you can imagine, since IoMT is the Venn diagram of the vulnerably of both healthcare and IoT, the area of overlap is extremely vulnerable. And the impact of a successful cyberattack doesn’t just affect data and money, it can affect patient safety.
It’s a well understood challenge. “The healthcare industry has a lot working against it on the cybersecurity front—a rapidly expanding attack surface, outdated legacy technology, budget constraints and a global cyber talent shortage.”
What’s the industry to do? Is there some solution to address the vulnerability in IoMT devices? Yes, threat modeling.
Threat modeling doesn’t care if it’s an IT system, an OT system or IoT devices. It also doesn’t care if it’s healthcare, finance or retail. Threat modeling is high-level, holistic approach to identifying system threats and mitigating them before they happen.
And ThreatModeler is the easiest way to get started with threat modeling. There are one-click threat models available for a number of IoMT devices already. No specific expertise is required.


